LLM Leverage: Where to Build and Where to Bet
Introduction#
What do electricity, steam engines, printing presses, and large language models (LLMs) have in common?
They are (likely) General Purpose Technologies: technologies that have a broad impact on all sectors of the economy.
Given this broad applicability, how do we reason about the impact of LLMs? If you’re an investor or builder, where do you start?
The GPTs are GPTs (1) paper by OpenAI provides one way to reason about the impact of LLMs. I replicate this paper using GPT-3.5 as a classifier and look at the complete impact, according to this methodology and the most exposed industries.
The following analysis is targeted at two sets of people:
- Application builders who are looking for areas to build in.
- Investors who are trying to understand likely areas to invest in.
TL;DR#
We use “exposure” as our primary measure. At the task level, an “exposed” task is one that can be done more productively given some LLM technology. This definition can be extended to occupations (which comprise of tasks) and industries (which comprise of people doing occupations).
Greater exposure means more tasks can be aided by LLMs or tools built on top of LLMs. There is no surprise that industries that deal primarily with information are the most exposed. Back-offices of every industry are exposed.
I like exposure as it gives us a way to look at different industries. It also allows us (in the future) to change the definition subtly (if we want to look at job replacement vs. productivity increases) and rerun the whole analysis in the same way.
We define 3 types of exposure:
Alpha: What is the impact of a general chatbot like ChatGPT on productivity increase.
This measure is a base level measure. This represents the key opportunity for Foundation Model companies and anyone providing generalized tools on top of foundational models - aka Google and OpenAI.
Zeta: What is the impact of ChatGPT + Tooling on productivity increase.
This measure looks at the impact of tooling. It’s a superset of alpha, so no major surprise that the top industries are mostly similar.
Delta: What is the marginal impact of Tooling:
delta = (zeta - alpha). This is a narrower version of zeta exposure. This is the key market for application builders.
Top-5 industries by Delta#
- Finance and insurance
Management of companies and enterprises(Ignore)- Professional, scientific, and technical services
- Education services
- Information
Note: Management is ignored because while it comes up as an occupation code, it doesn’t show up in industry output (where it gets layered in).
Top-5 industries by Output-Delta#
Different industries have different output. If we look out output-weighted delta, we get a slightly different picture. If you believe that one should be playing in a big pond, this is the list to look at:
- Finance and insurance
- Manufacturing
- Professional, scientific, and technical services
- Information
- Health care and social assistance
This list intuitively feels like the right list to be building tooling in. Huge output, large exposure and large delta values (tooling has a major impact). If you’re investing or building in AI tooling (outside of hardware, foundational models, and orchestration software) this is a good lens to start with.
Methods#
The method is based on the GPTs are GPTs paper (1). The high level approach is as follows:
- We have data from the US Bureau of Labor Statistics on employment by industry and occupation.
- For each occupation, we have a set of Tasks and for each Task, we have a set of Detailed Work Activities (DWA).
- We can classify these DWAs into 3 categories:
- Direct exposure: The DWA can be done by a LLM alone.
- Exposure by LLM-powered applications: The DWA can be done by a LLM + Tooling.
- Exposure given image capabilities: The DWA can be done by a LLM + Tooling + Image capabilities.
- We can then back out the exposure of each occupation and industry to LLMs.
For precise classification prompts, see the appendix or the code.
Important note: We are estimating exposure to LLMs. An exposed job simply means that the job could be done with far greater efficiency using LLMs. It does not imply job loss or redundancies.
For example, we’re seeing a lot of LLM use for software development (eg. Github Co-pilot, ChatGPT, Cursor.so). These applications seem to be making software developers more efficient, not redundant. Similary, we would expect a legal assistant (like Harvey) to make paralegals and lawyers more efficient, not redundant.
It’s simply too early to tell whether LLMs replace jobs (like switchboard operators) or just them more efficient, causing the industry to expand (like accountants after spreadsheets).
Data#
To understand and contextualize the results, we need to understand the data used.
- O*Net Database (2) maintains data on all occupations (eg. CEO)
- Each occupation is broken into a set of Tasks (eg. “Direct or coordinate an organization’s financial or budget activities to fund operations, maximize investments, or increase efficiency.”)
- Each task is broken into a set of Activities (eg. “Analyze impact of legal or regulatory changes.”)
- US Bureau of Labor Statistics (3) maintains data on employment data by industry and occupation. This matrix has the employment mix of every industry (eg. the “Rental and leasing services” industry employs “Marketing managers”, “Sales managers”, etc.)
Example#
Let’s work through an example to understand how the whole flow works.
industry_output[(industry_output["Supergroup"] == "Information") & (~industry_output["is_supergroup"])]
This gives us a look at everything that is part of the “Information” supergroup. Truncated list:
- Software publishers
- Computing infrastructure providers, data processing, web hosting, and related service
- Web search portals, libraries, archives, and other information services(3)
- Publishing industries(3)
Let’s look at Software Publishers which is NAICS Code 5132, by employment:
bls_matrix[bls_matrix["industry_code"].str.startswith("5132")].nlargest(10, "employment_2022")
The “Software Publishers” industry employs people who do the following jobs (truncated):
- Software developers
- Computer and information systems managers
- Computer user support specialists
- Sales representatives, wholesale and manufacturing, technical and scientific products
A Software developer does the following tasks (truncated):
task_statements[task_statements["onetsoc_code"] == "15-1252.00"]
- Analyze information to determine, recommend, and plan installation of a new system or modification of an existing system.
- Analyze user needs and software requirements to determine feasibility of design within time and cost constraints.
- Confer with data processing or project managers to obtain information on limitations or capabilities for data processing projects.
- Confer with systems analysts, engineers, programmers and others to design systems and to obtain information on project limitations and capabilities, performance requirements and interfaces.
- Consult with customers or other departments on project status, proposals, or technical issues, such as software system design or maintenance.
An example task has the following detailed activities:
tasks_to_dwas[tasks_to_dwas["task_id"] == 21669]

dwa_reference[dwa_reference["dwa_id"].isin(["4.A.2.b.4.I03.D15", "4.A.4.b.4.I06.D07"])]["dwa_title"].to_list()
- Develop testing routines or procedures.
- Manage information technology projects or system activities.
We can take each of these and classify them. For example, we get the following classifications:
- 1 - Direct exposure
- 2 - Exposure by LLM-powered applications
We can now back this classification out all the way, through the employment matrix and get to an overally alpha, zeta etc. number for the entire “Information” industry.
Analysis#
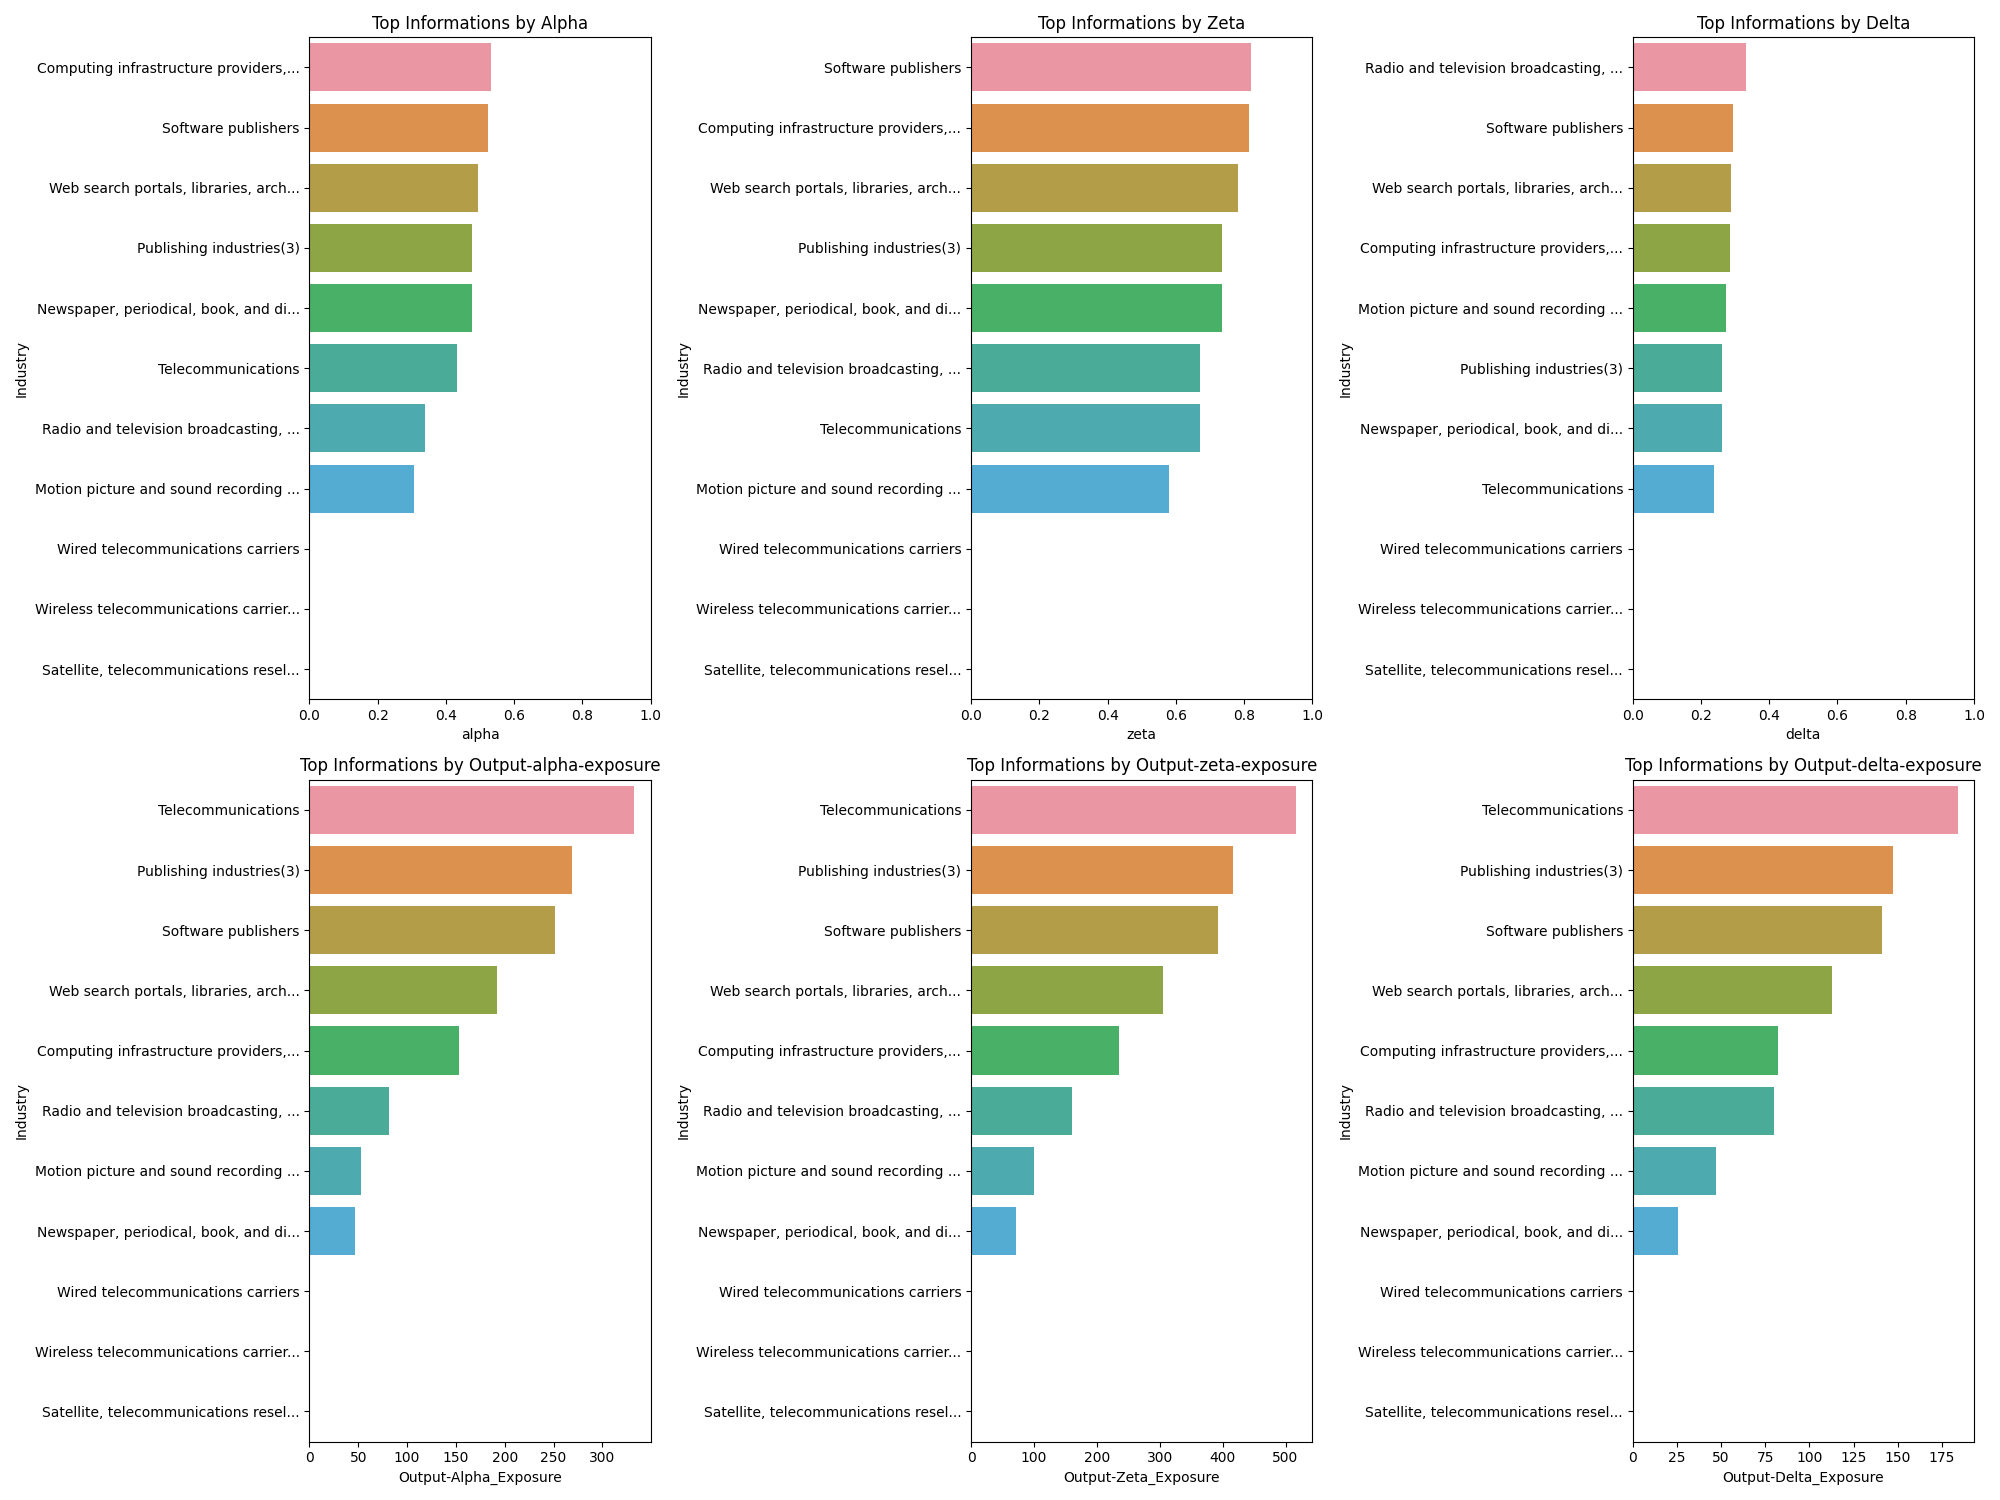
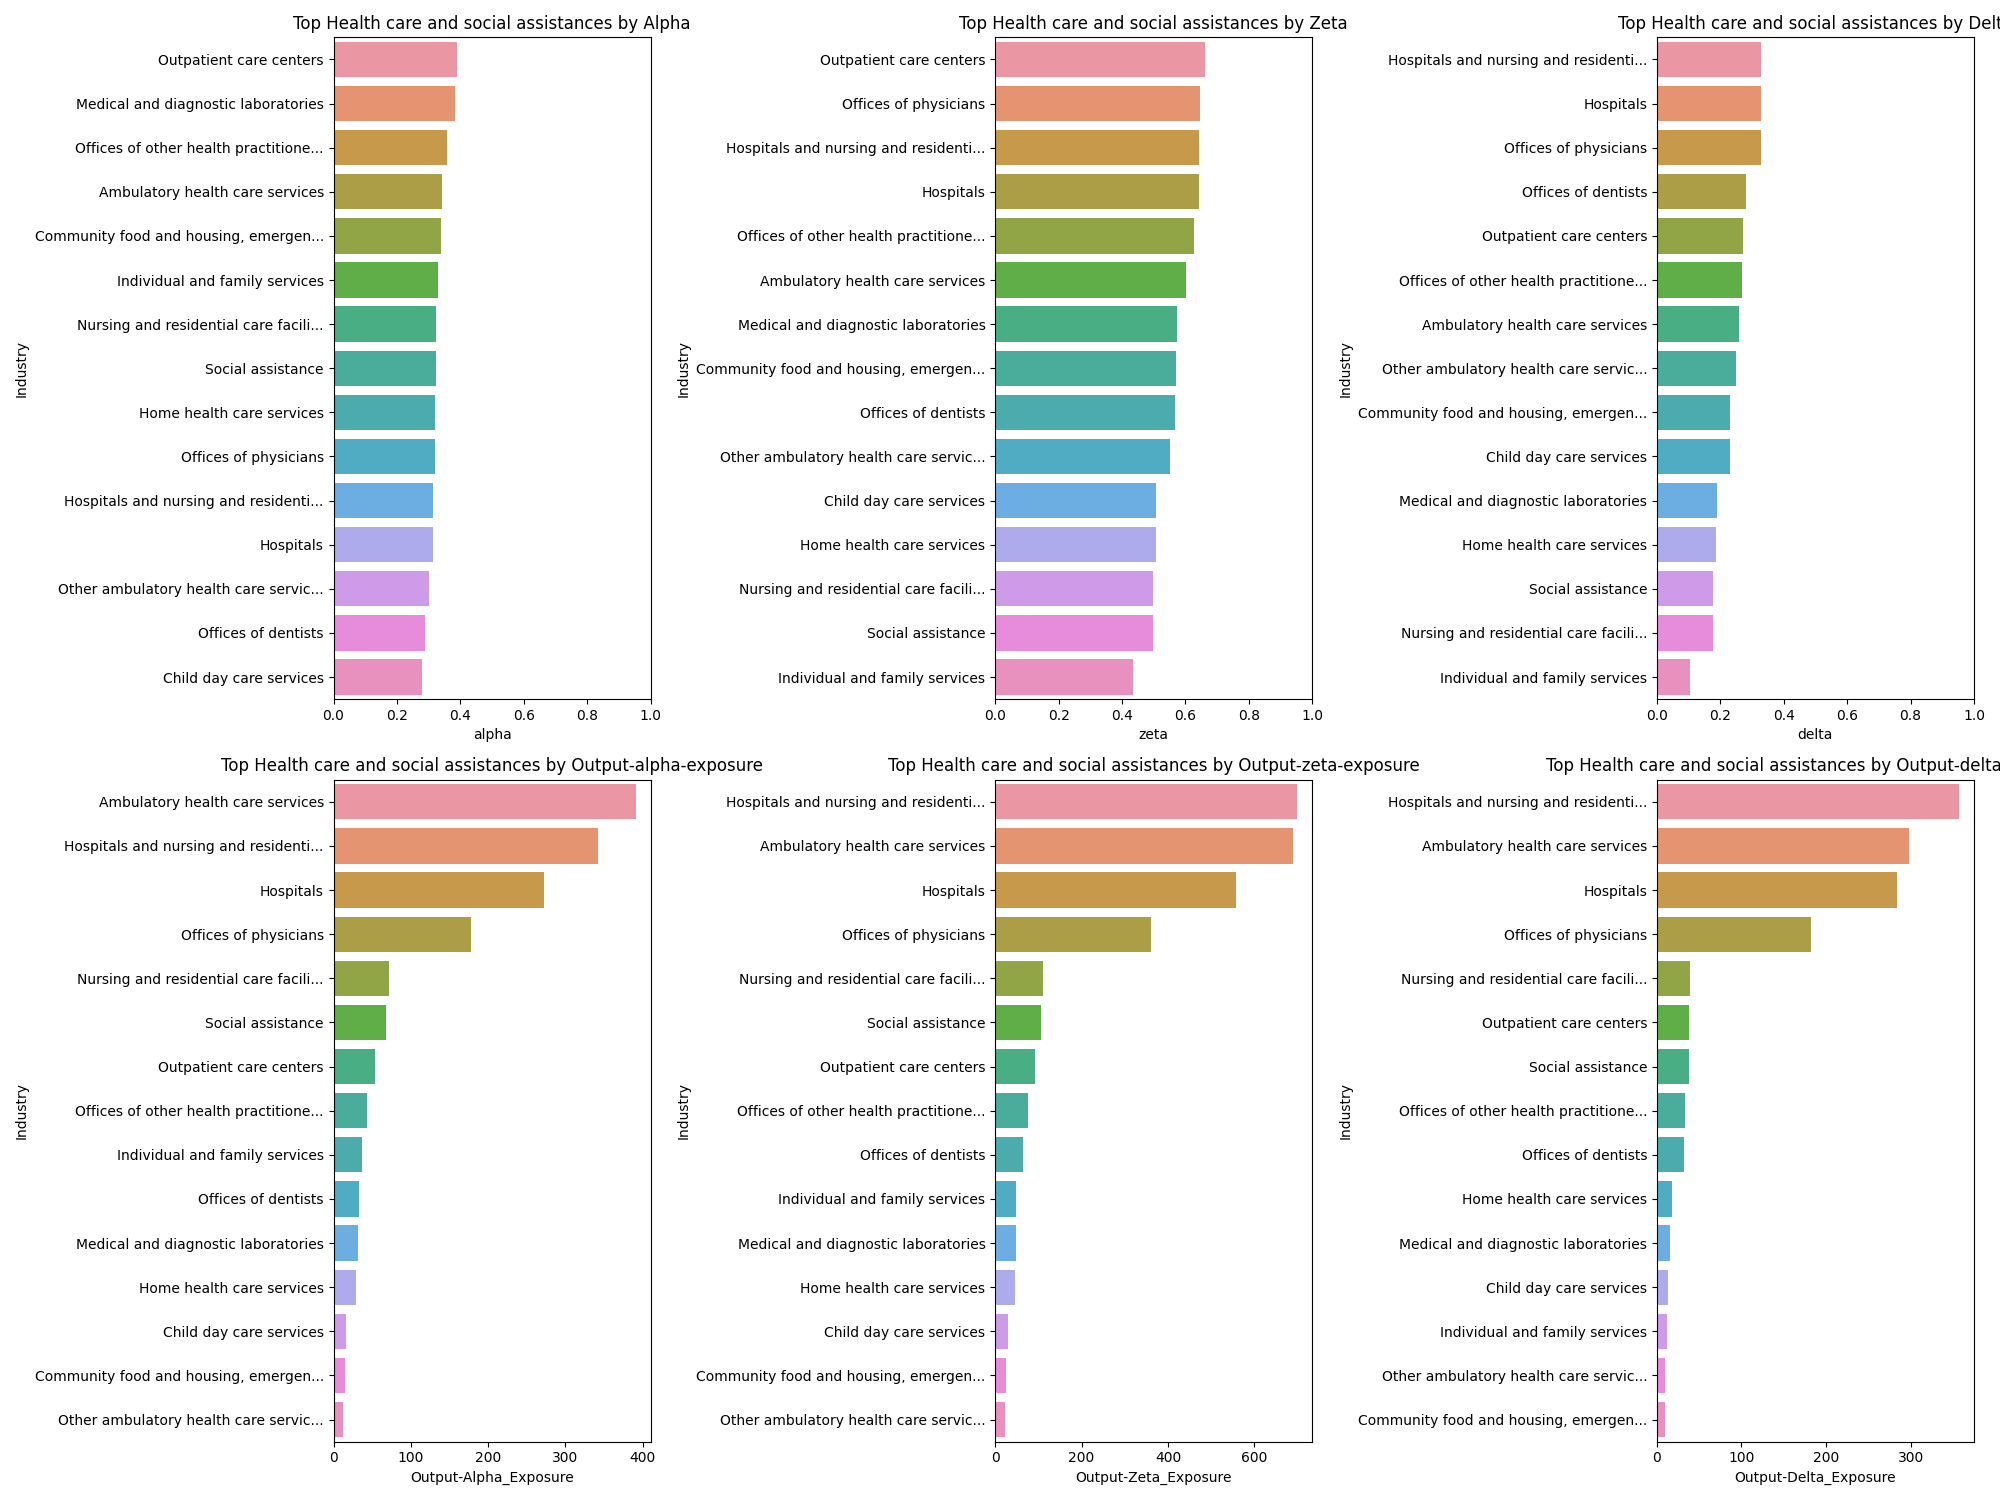
The analysis section is graph heavy. Each graph follows a similar format: in a 2X3 grid, we see a list of industries or occupations. The first row is alpha, zeta, and delta scores, the second row is the same, but multiplied by the output of the industry.
Top Supergroups#
A Supergroup is a set of industries, bunched together.
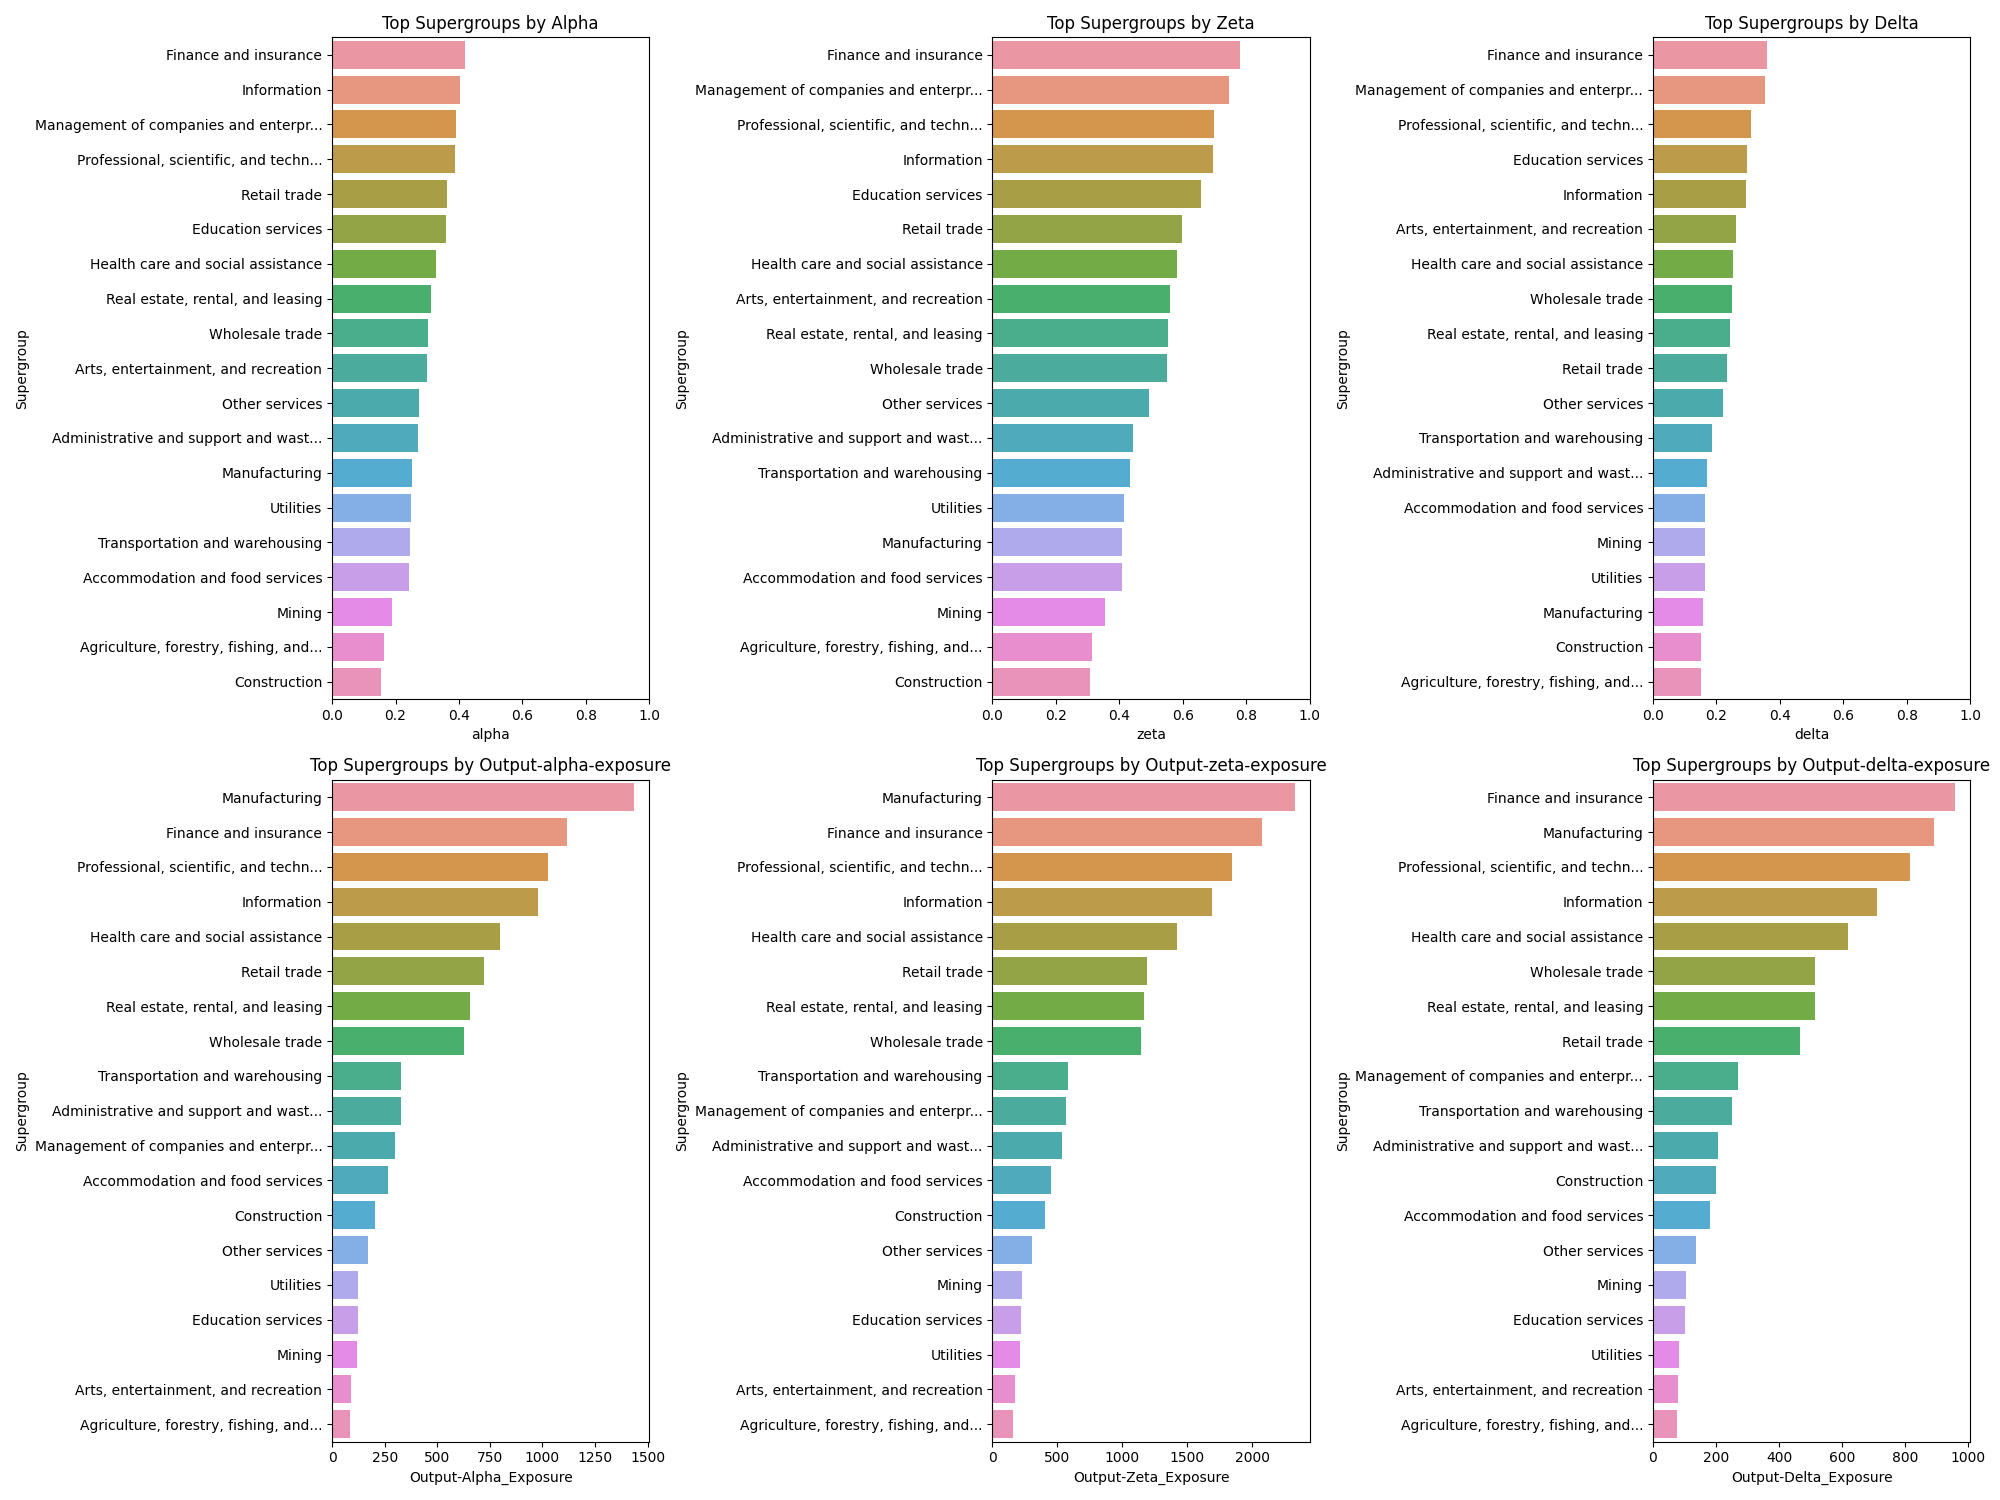
Top Groups#
Groups look at one more level of granularity compared to supergroups.
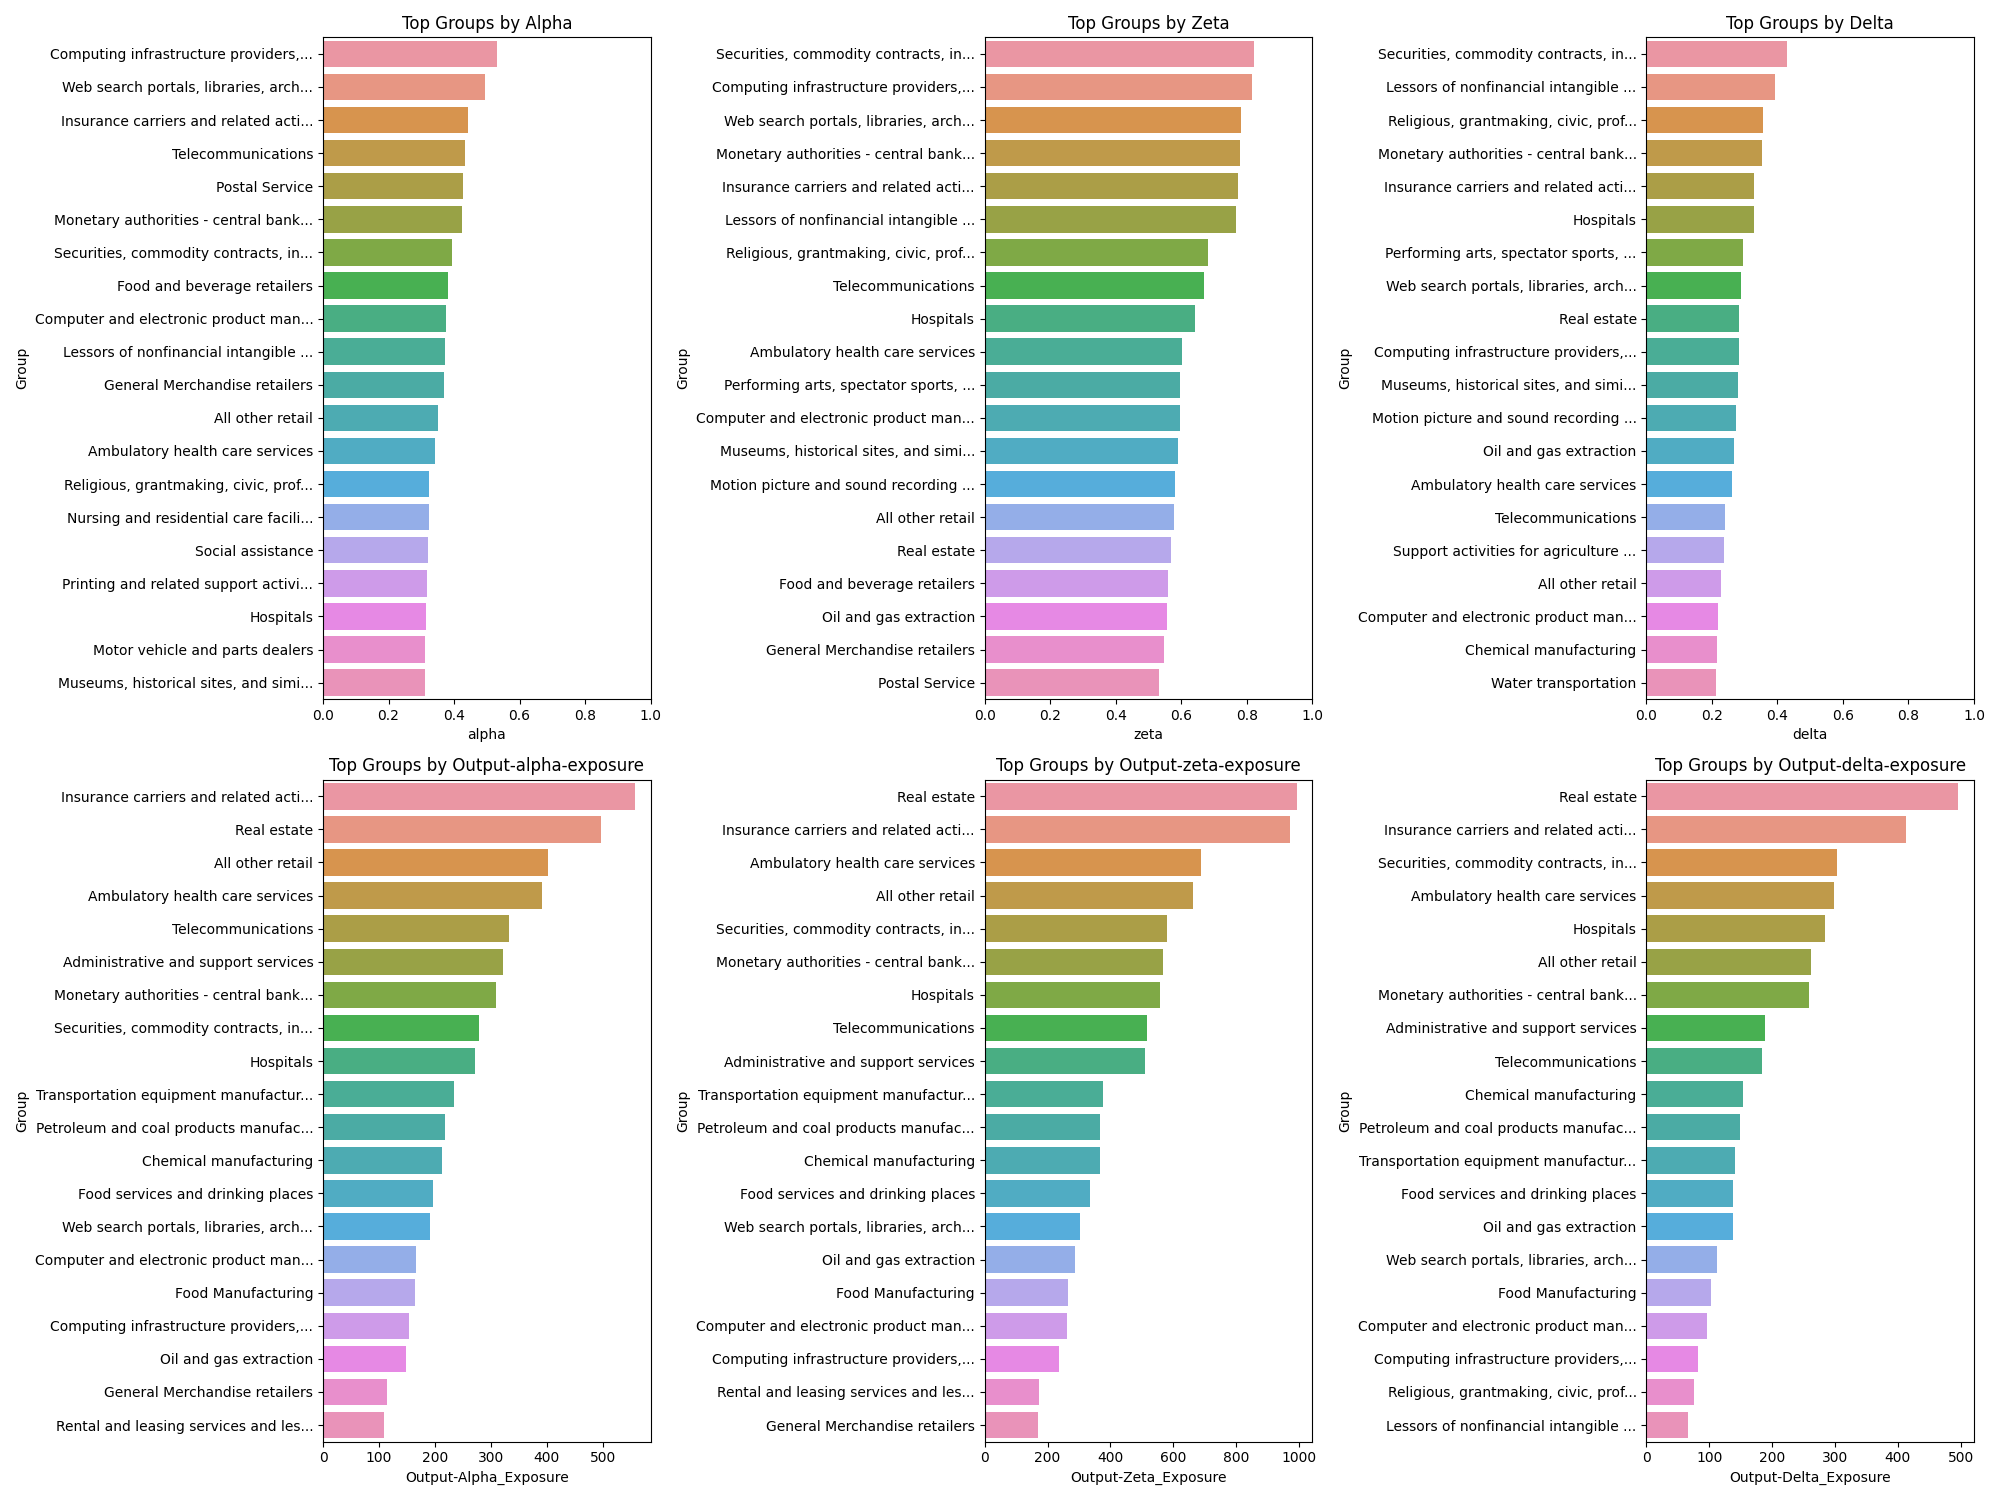
Looking at these, a few industries stand out as being worthy of deeper dives:
- Finance and insurance
- Professional, scientific, and technical services
- Information
- Educational services
- Health care and social assistance
Deep Dives#
The following industries deserve their own deep dives:
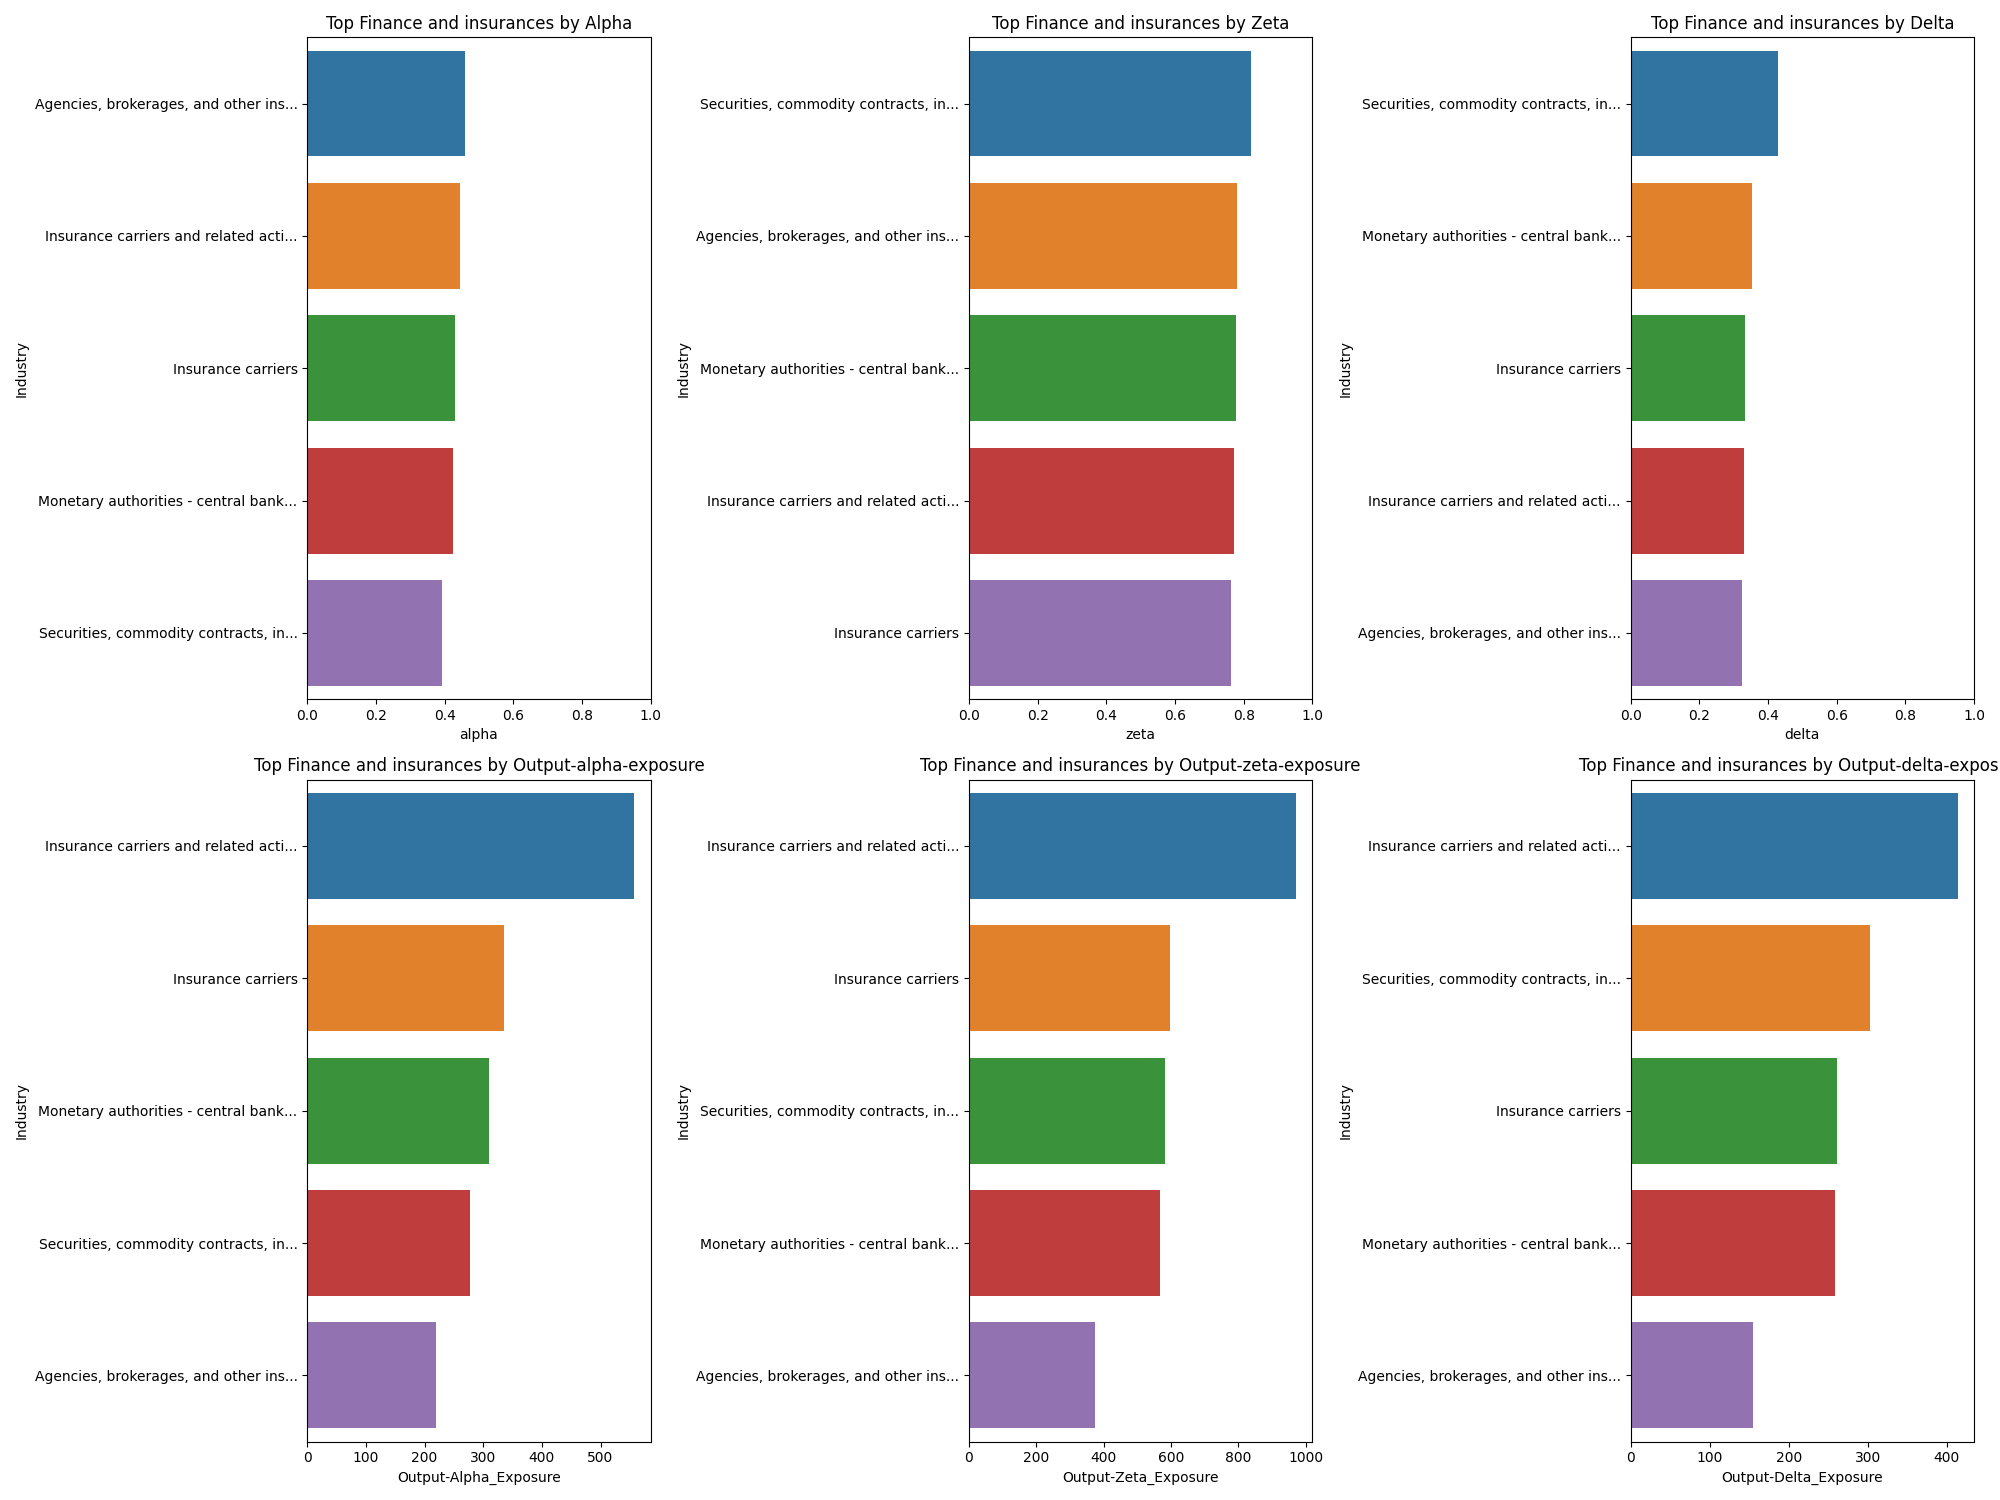
Finance and insurance#
Two interesting aspects of finance and insurance:
- Base level alpha is very high. As a result, the delta value is lower. Building tooling in this space could be lucrative but one has to be careful about building too close to a general purpose LLM-enabled task.
- The output is massive. Finance is a huge, huge industry. The scaled impact of even small tooling improvements could be massive.
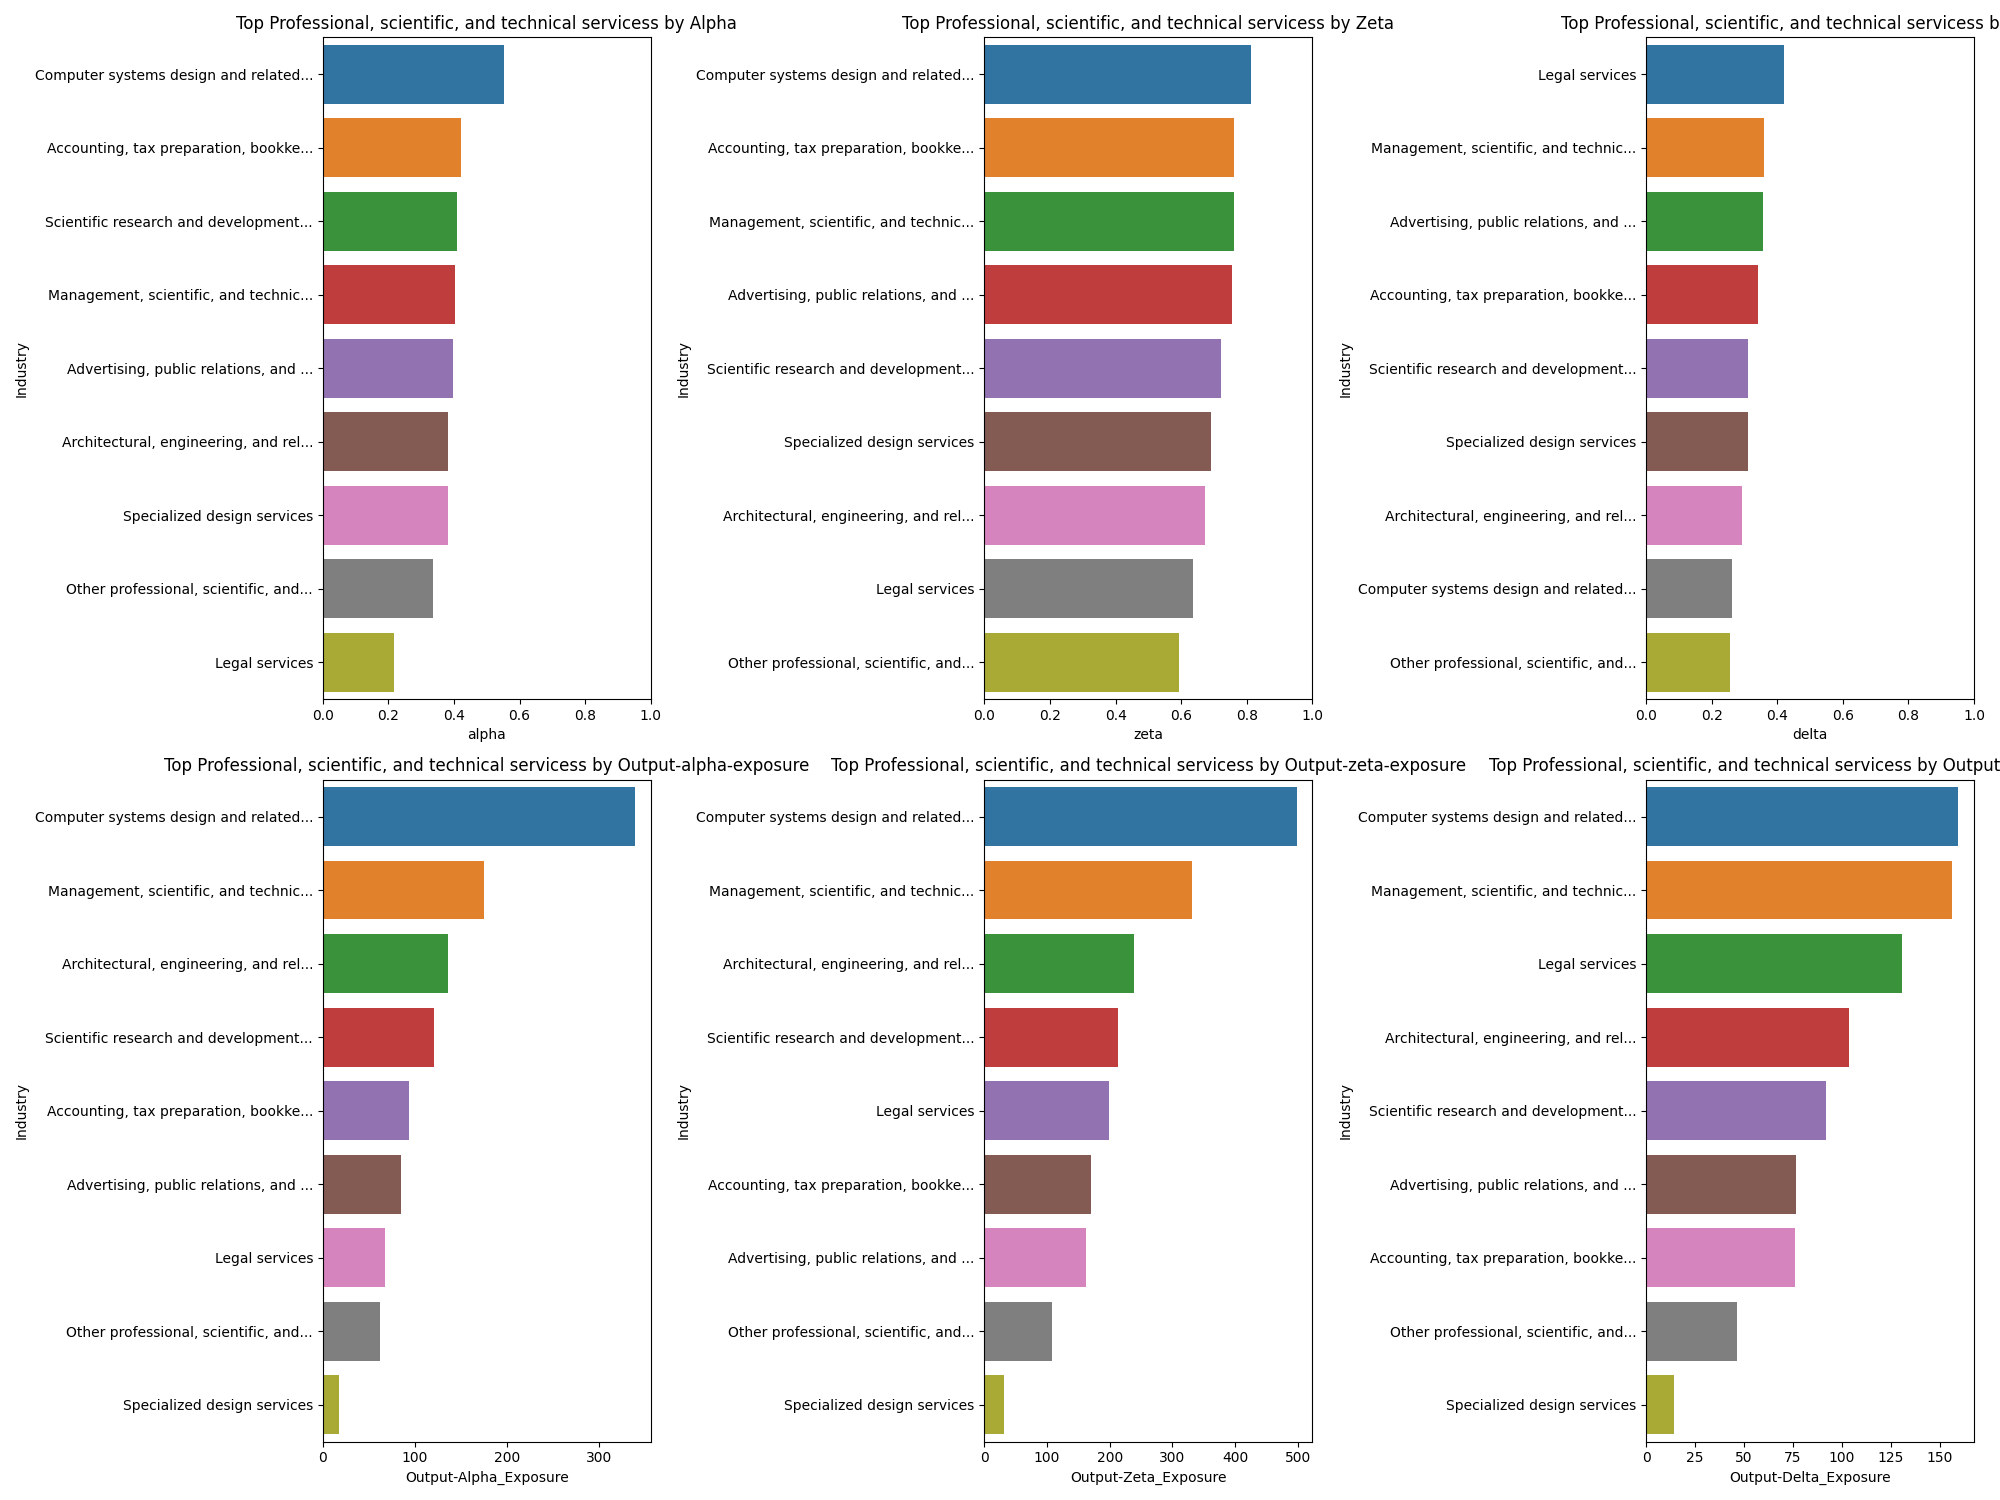
Professional, scientific, and technical services#
This is the motherload of the tooling bonanza.
- Legal
- Advertising
- Accounting
- Design
- Architecture
So much whitespace to build amazing, bespoke tooling.
Information#
Some whitespace for software. Like finance, high base levels of alpha. I admittedly do not understand why telecom is such a huge output industry or why the scaled output is so high.
Healthcare#
I am not a healthcare expert. If someone wants to collaborate and add a commentary, I would welcome it.
Conclusion#
Thanks for making it all the way here!
Using exposure classification to figure out what industries are highly exposed seems like a reasonable first pass to understand the impact of LLMs on the broader economy. I like it because it widens my aperture to think of all the areas where people work, where better tooling will lead to productivity increases. It’s not perfect, but it’s certainly a start.
What about Foundational Models or Orchestration?#
Martin Casado at a16z had a great post about the Generative AI Platform.
The Model provider and Orchestration layers lend themselves to reason - we understand model copabilities and dimensions of price, speed, data privacy etc. Similarly, on the tooling layer, we know some of the problems associated with LLMs and how to build tooling to overcome them.
However, the application layer remains both the great unknown and the great promise. I hope to understand this layer, in a systematic way, to provide guideposts for those of us looking for gold. Hence this analysis solely looks at the Application Layer.
Reference#
- GPTs are GPTs paper: https://arxiv.org/abs/2303.10130
- O*Net Database: https://www.onetcenter.org/database.html#all-files
- Bureau of Labor Statistics, Occupation Data: https://www.bls.gov/emp/data/occupational-data.htm
- How will Language Modelers like ChatGPT Affect Occupations and Industries: https://arxiv.org/abs/2303.01157
- a16z: Who owns the Generative AI Platform: https://a16z.com/who-owns-the-generative-ai-platform/
Appendix#
Software#
All the data and software for this is availble and open source. You can find the datasets above, the software is the following repo:
https://github.com/radoshi/gptsaregpts
Detailed classification prompt#
## 1 – Direct exposure
Label tasks 1 if direct access to the LLM through an interface like ChatGPT or the OpenAI playground alone can reduce the time it takes to complete the task with equivalent quality by at least half. This includes tasks that can be reduced to:
- Writing and transforming text and code according to complex instructions,
- Providing edits to existing text or code following specifications,
- Writing code that can help perform a task that used to be done by hand,
- Translating text between languages,
- Summarizing medium-length documents,
- Providing feedback on documents,
- Answering questions about a document, or
- Generating questions a user might want to ask about a document.

## 2 – Exposure by LLM-powered applications
Label tasks 2 if having access to the LLM alone may not reduce the time it takes to complete the task by at least half, but it is easy to imagine additional software that could be developed on top of the LLM that would reduce the time it takes to complete the task by half. This software may include capabilities such as:
- Summarizing documents longer than 2000 words and answering questions about those documents
- Retrieving up-to-date facts from the Internet and using those facts in combination with the LLM capabilities
- Searching over an organization’s existing knowledge, data, or documents and retreiving information

Examples of software built on top of the LLM that may help complete worker activities include:
- Software built for a home goods company that quickly processes and summarizes their up-to-date internal data in customized ways to inform product or marketing decisions
- Software that is able to suggest live responses for customer service agents speaking to customers in their company’s customer service interface
- Software built for legal purposes that can quickly aggregate and summarize all previous cases in a particular legal area and write legal research memos tailored to the law firm’s needs
- Software specifically designed for teachers that allows them to input a grading rubric and upload the text files of all student essays and have the software output a letter grade for each essay
- Software that retrieves up-to-date facts from the internet and uses the capabilities of the LLM to output news summaries in different languages

## 3 – Exposure given image capabilities
Suppose you had access to both the LLM and a system that could view, caption, and create images. This system cannot take video media as inputs. This system cannot accurately retrieve very detailed information from image inputs, such as measurements of dimensions within an image. Label tasks as 3 if there is significant reduction in the time it takes to complete the task given access to a LLM and these image capabilities:
- Reading text from PDFs,
- Scanning images, or
- Creating or editing digital images according to instructions.

## N - Not confident
If you are not confident in your classification or if you believe it could go either way, label a task as En.